This appendix presents the main quantitative outputs of the demographic projections on household structures up to 2030.
Results are presented separately for each region (Lombardy and Sardinia). A comparative interpretation across regions is provided exclusively in Appendix C (Conclusions), where trends and structural differences are analyzed jointly.
Quantitative outputs are organized:
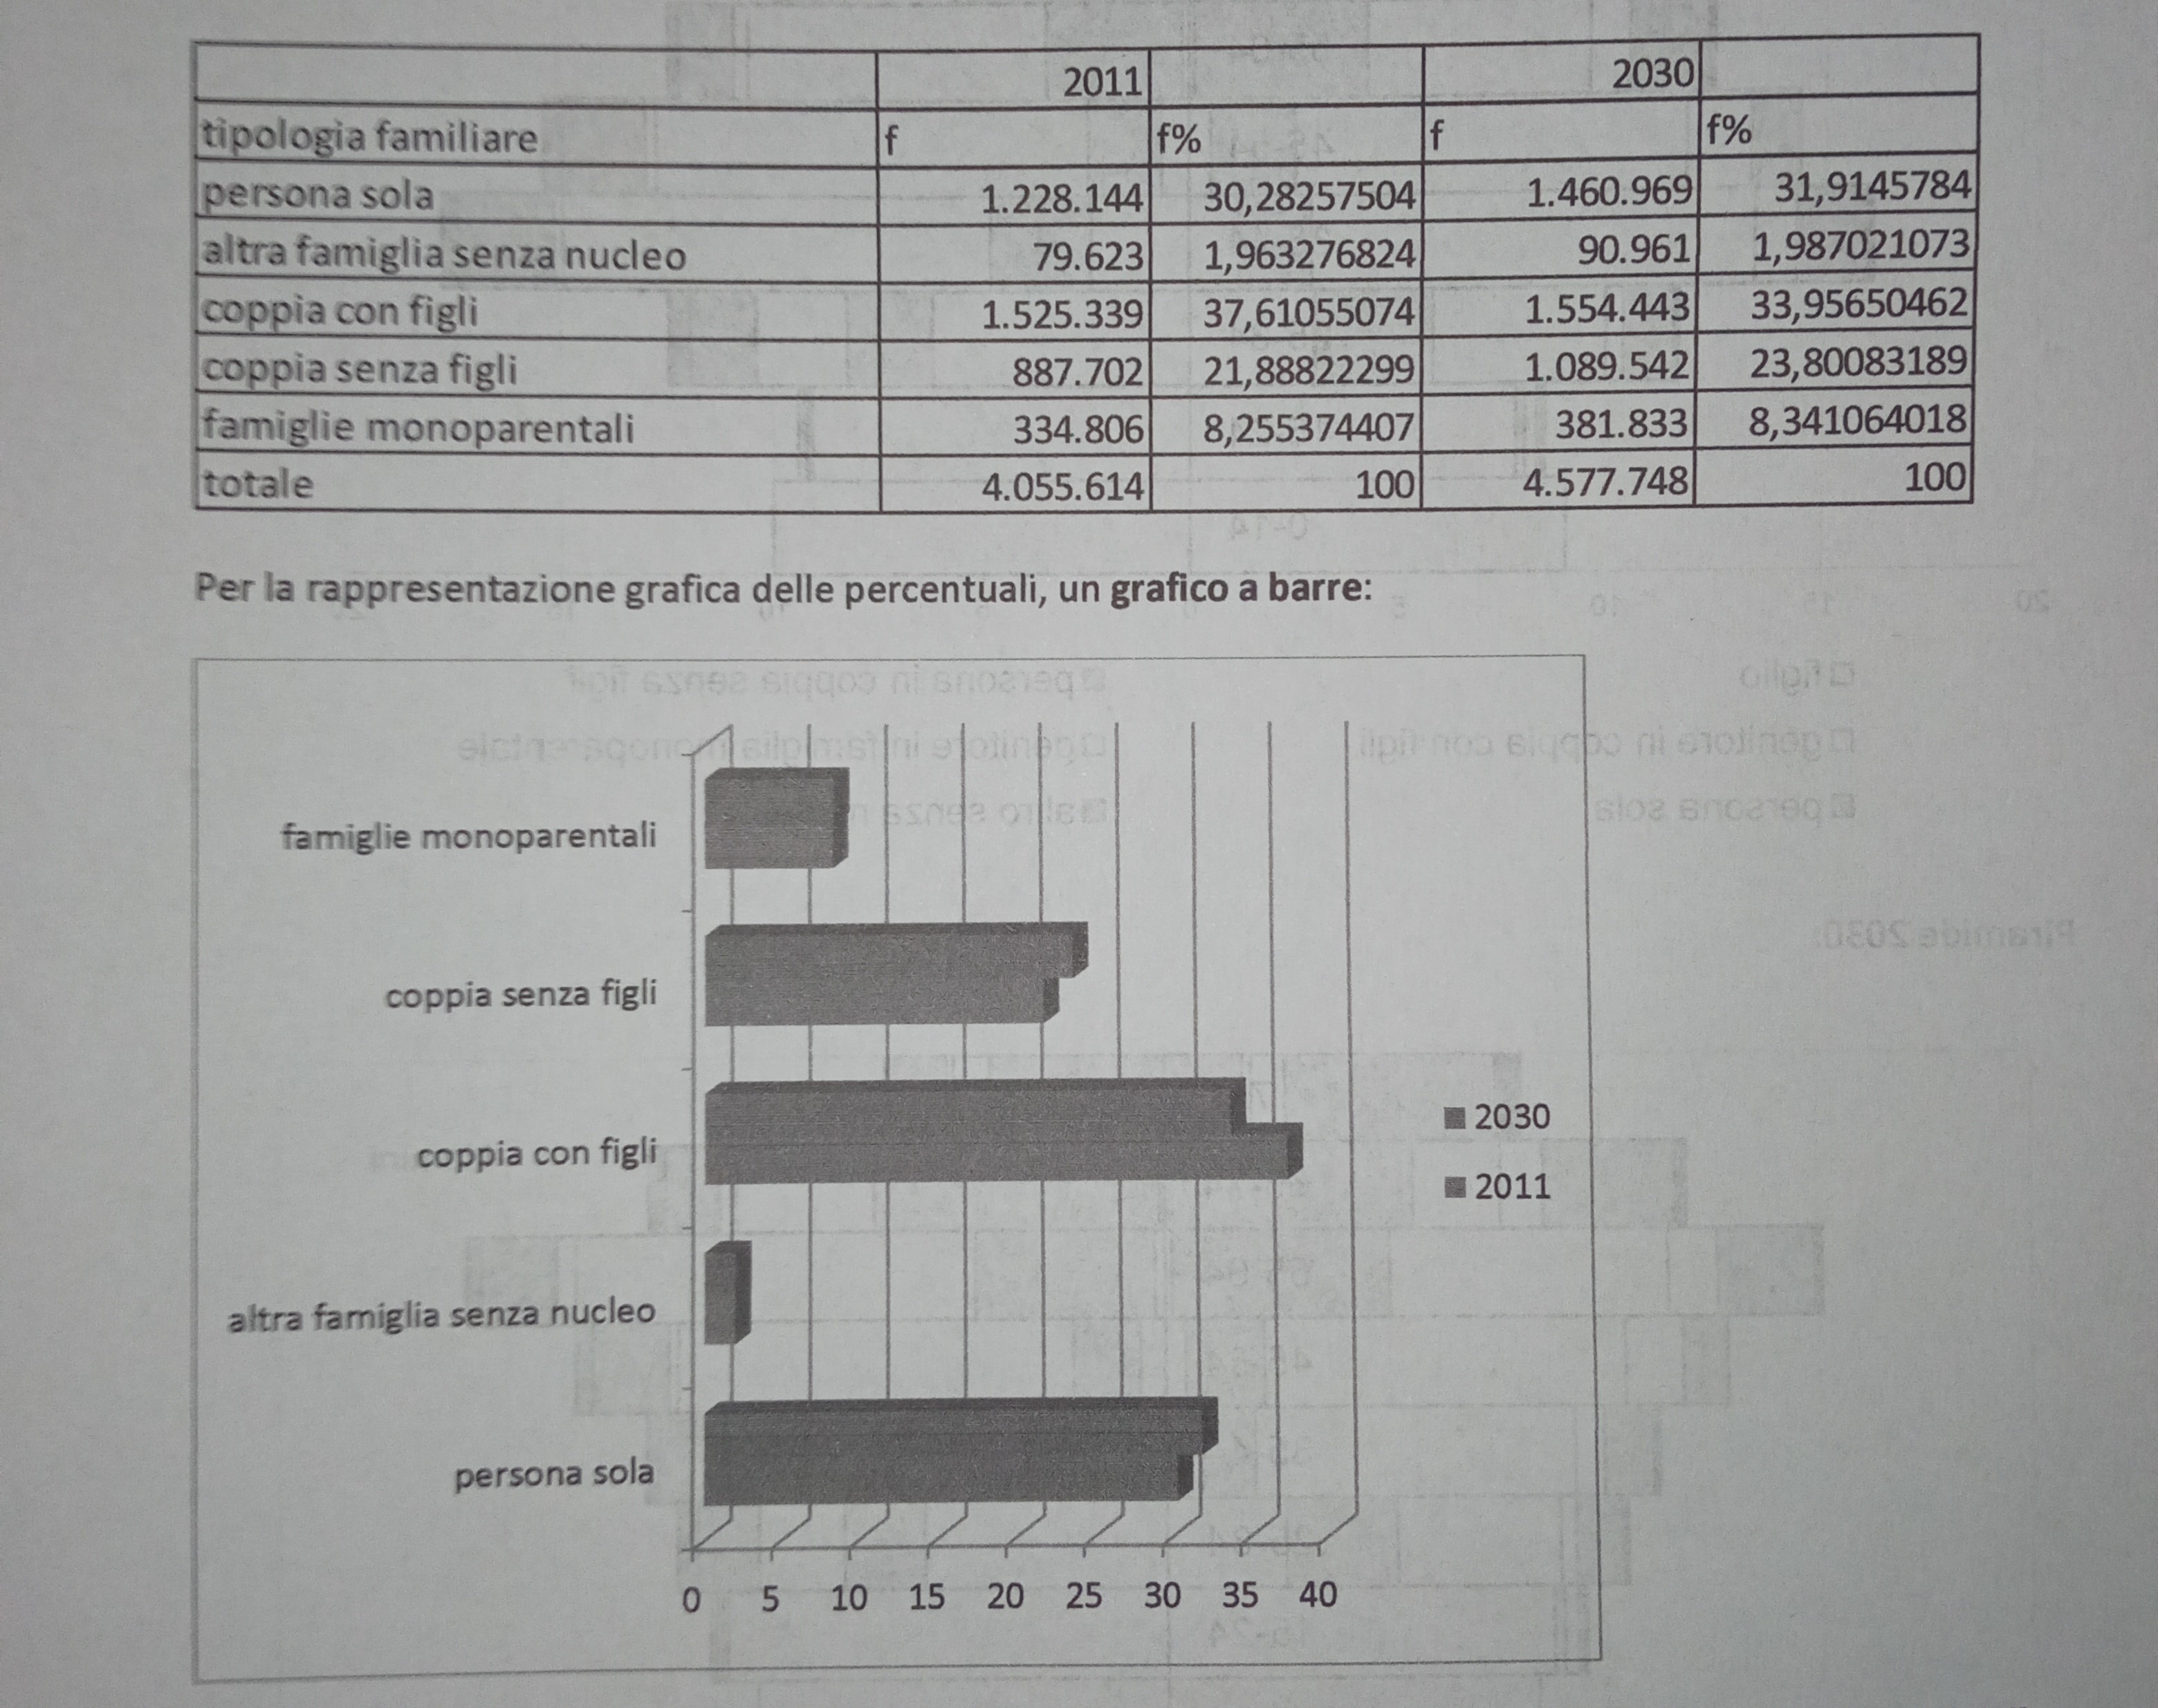
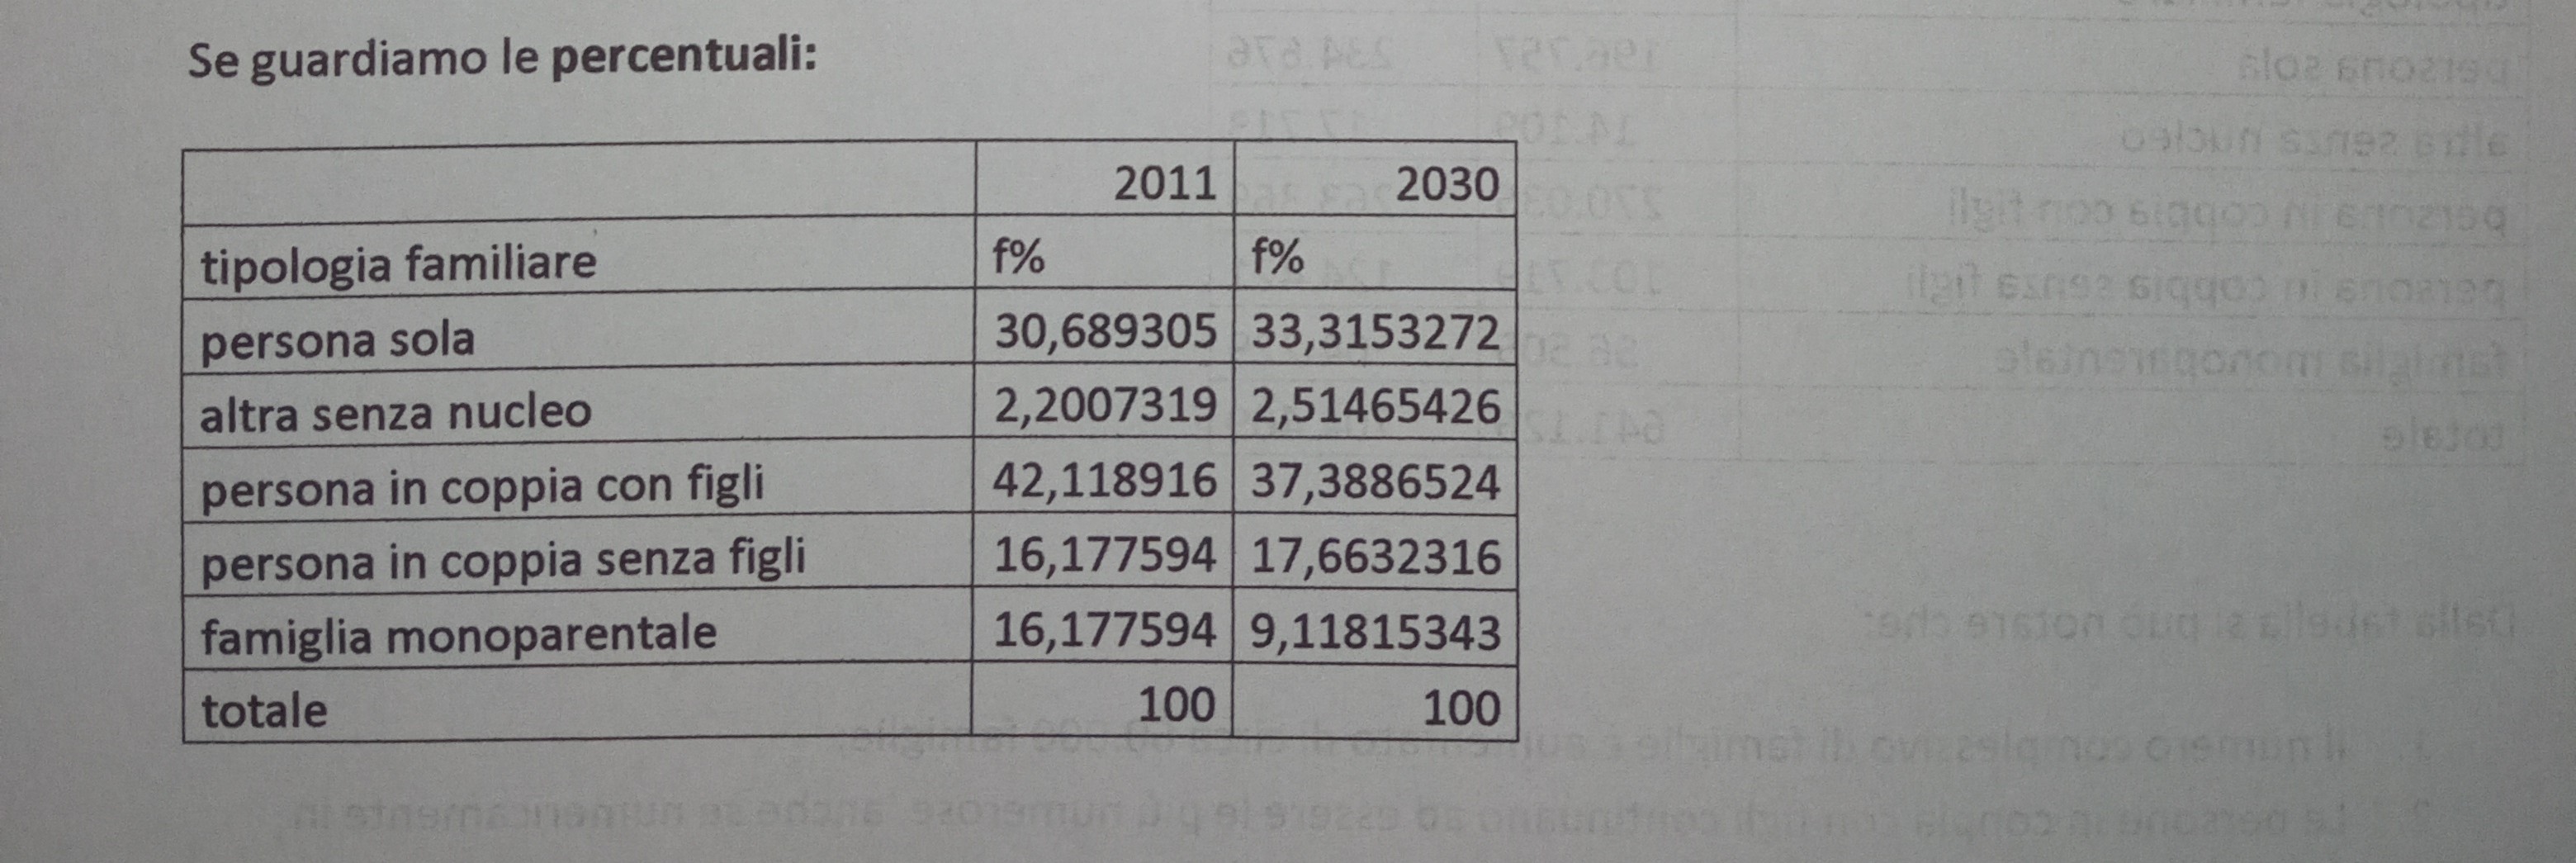
Line chart (percentages) – projection to 2030
Projected distribution of main household typologies in Lombardy up to 2030.
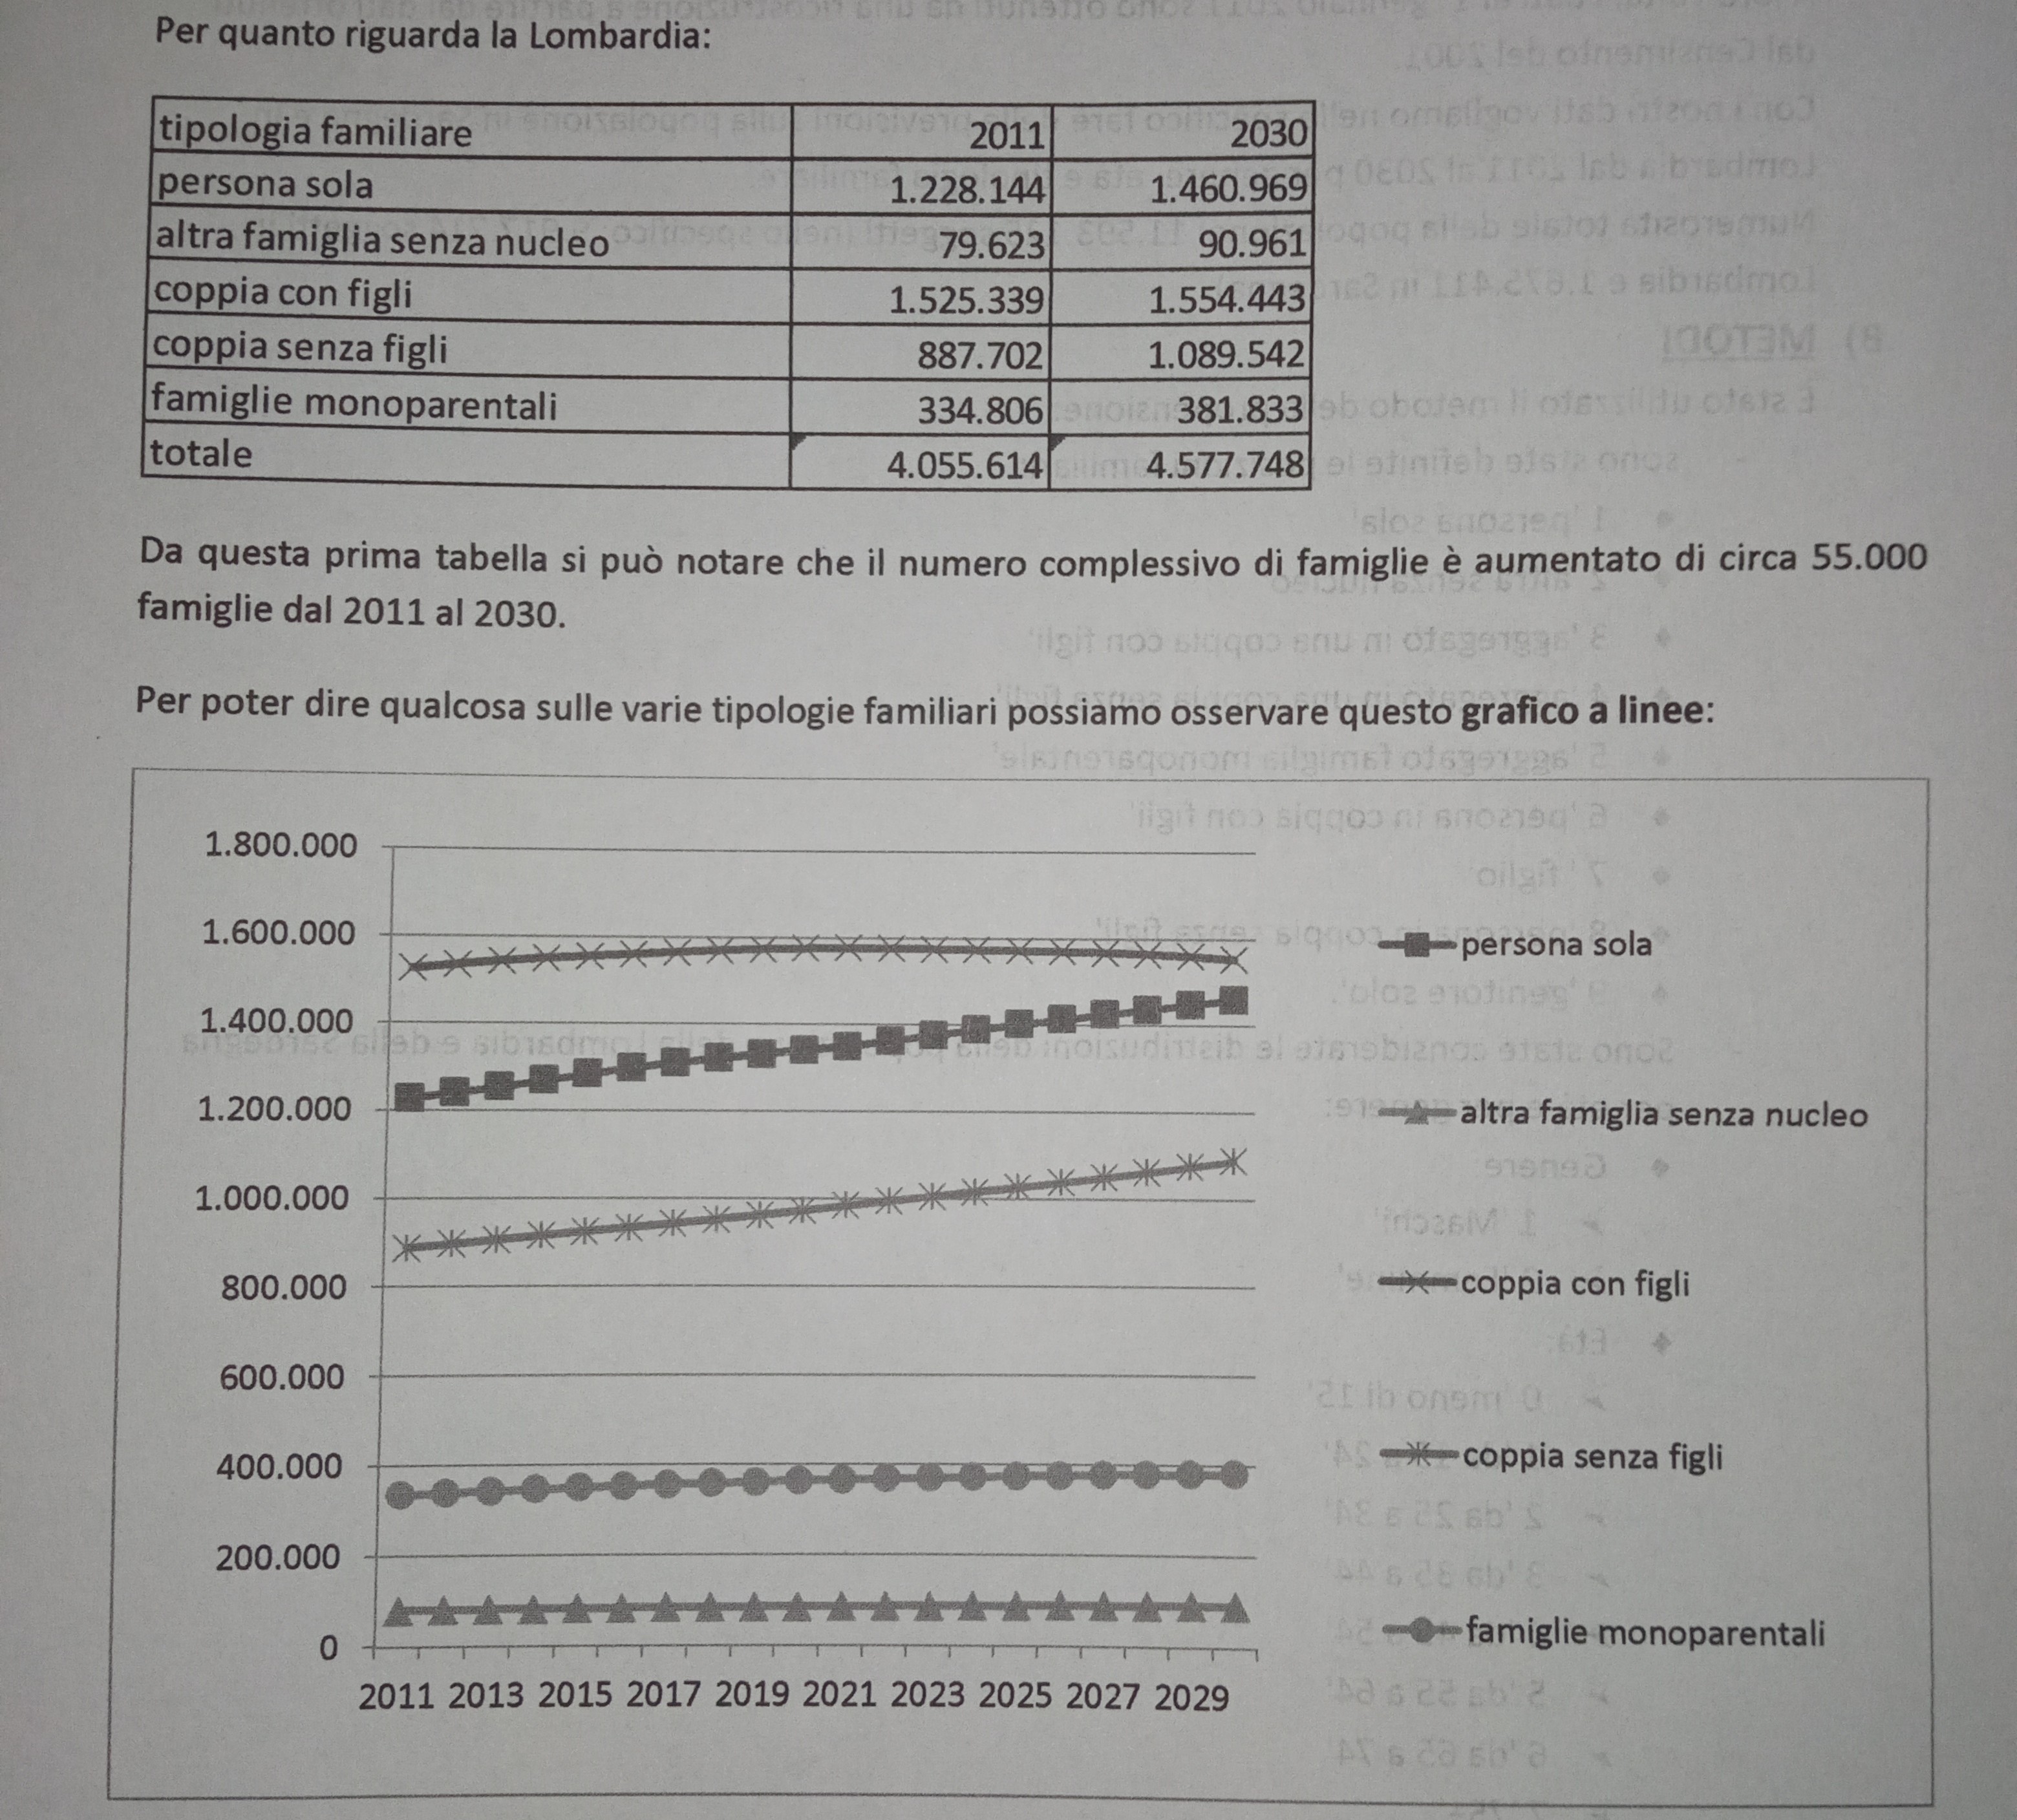
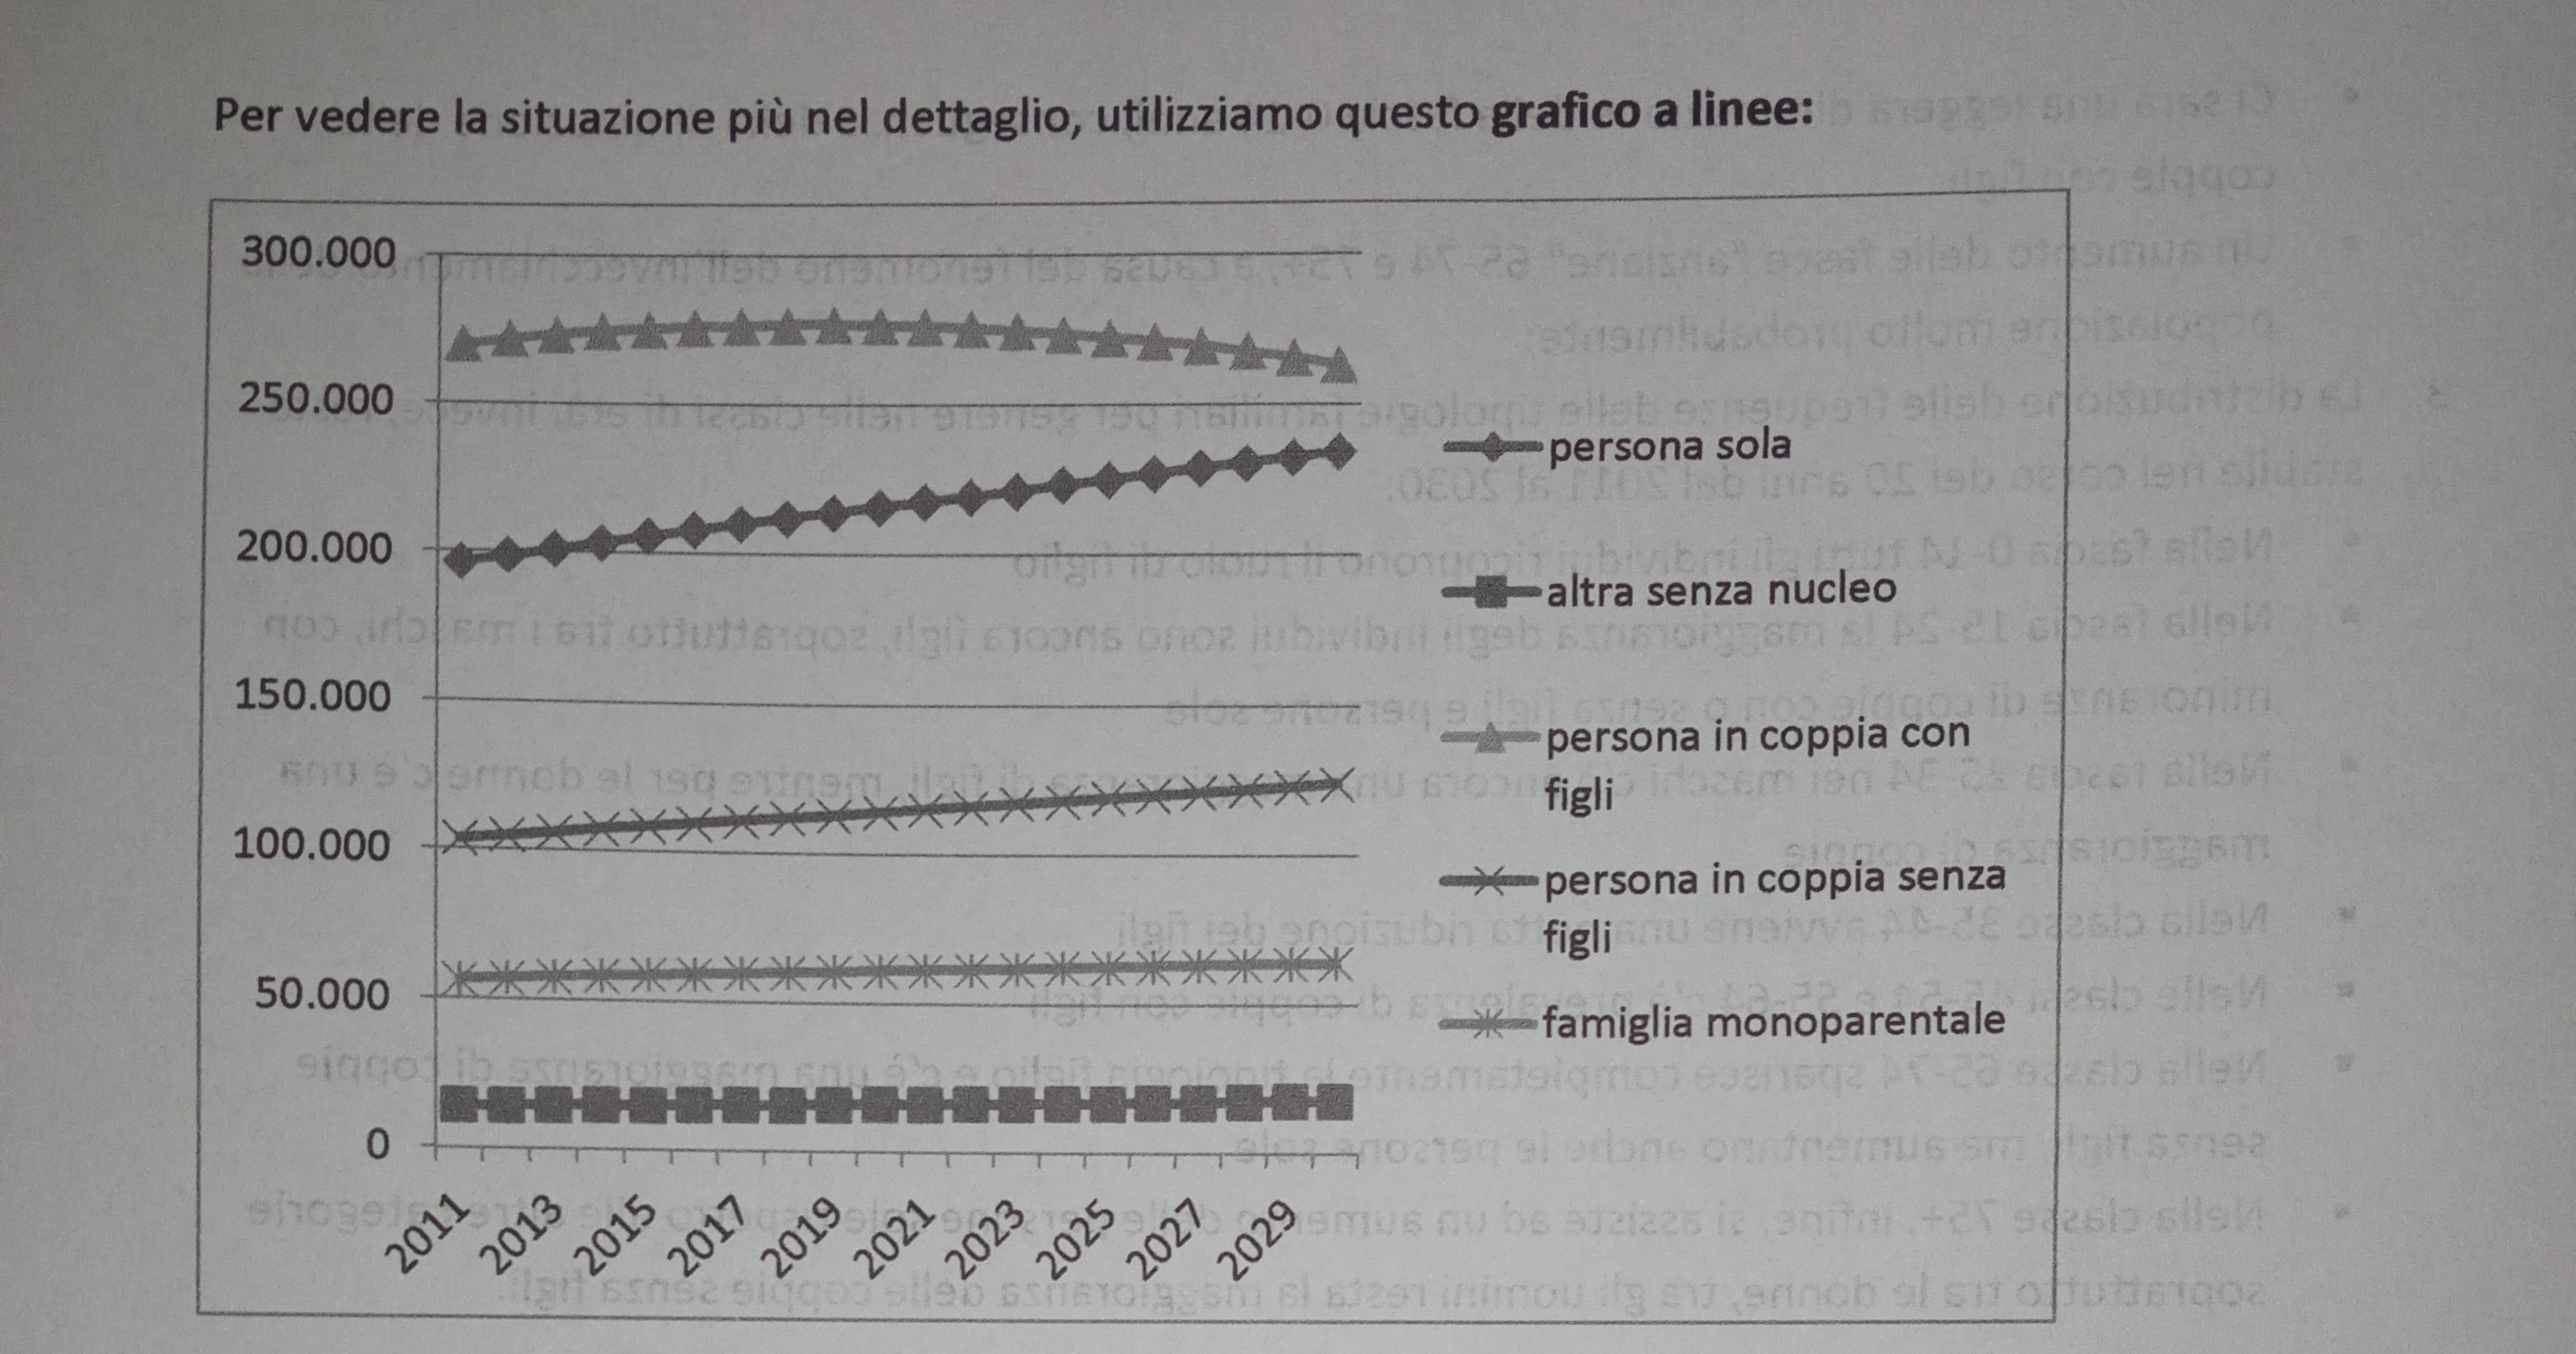
Line chart (absolute values) – projection to 2030
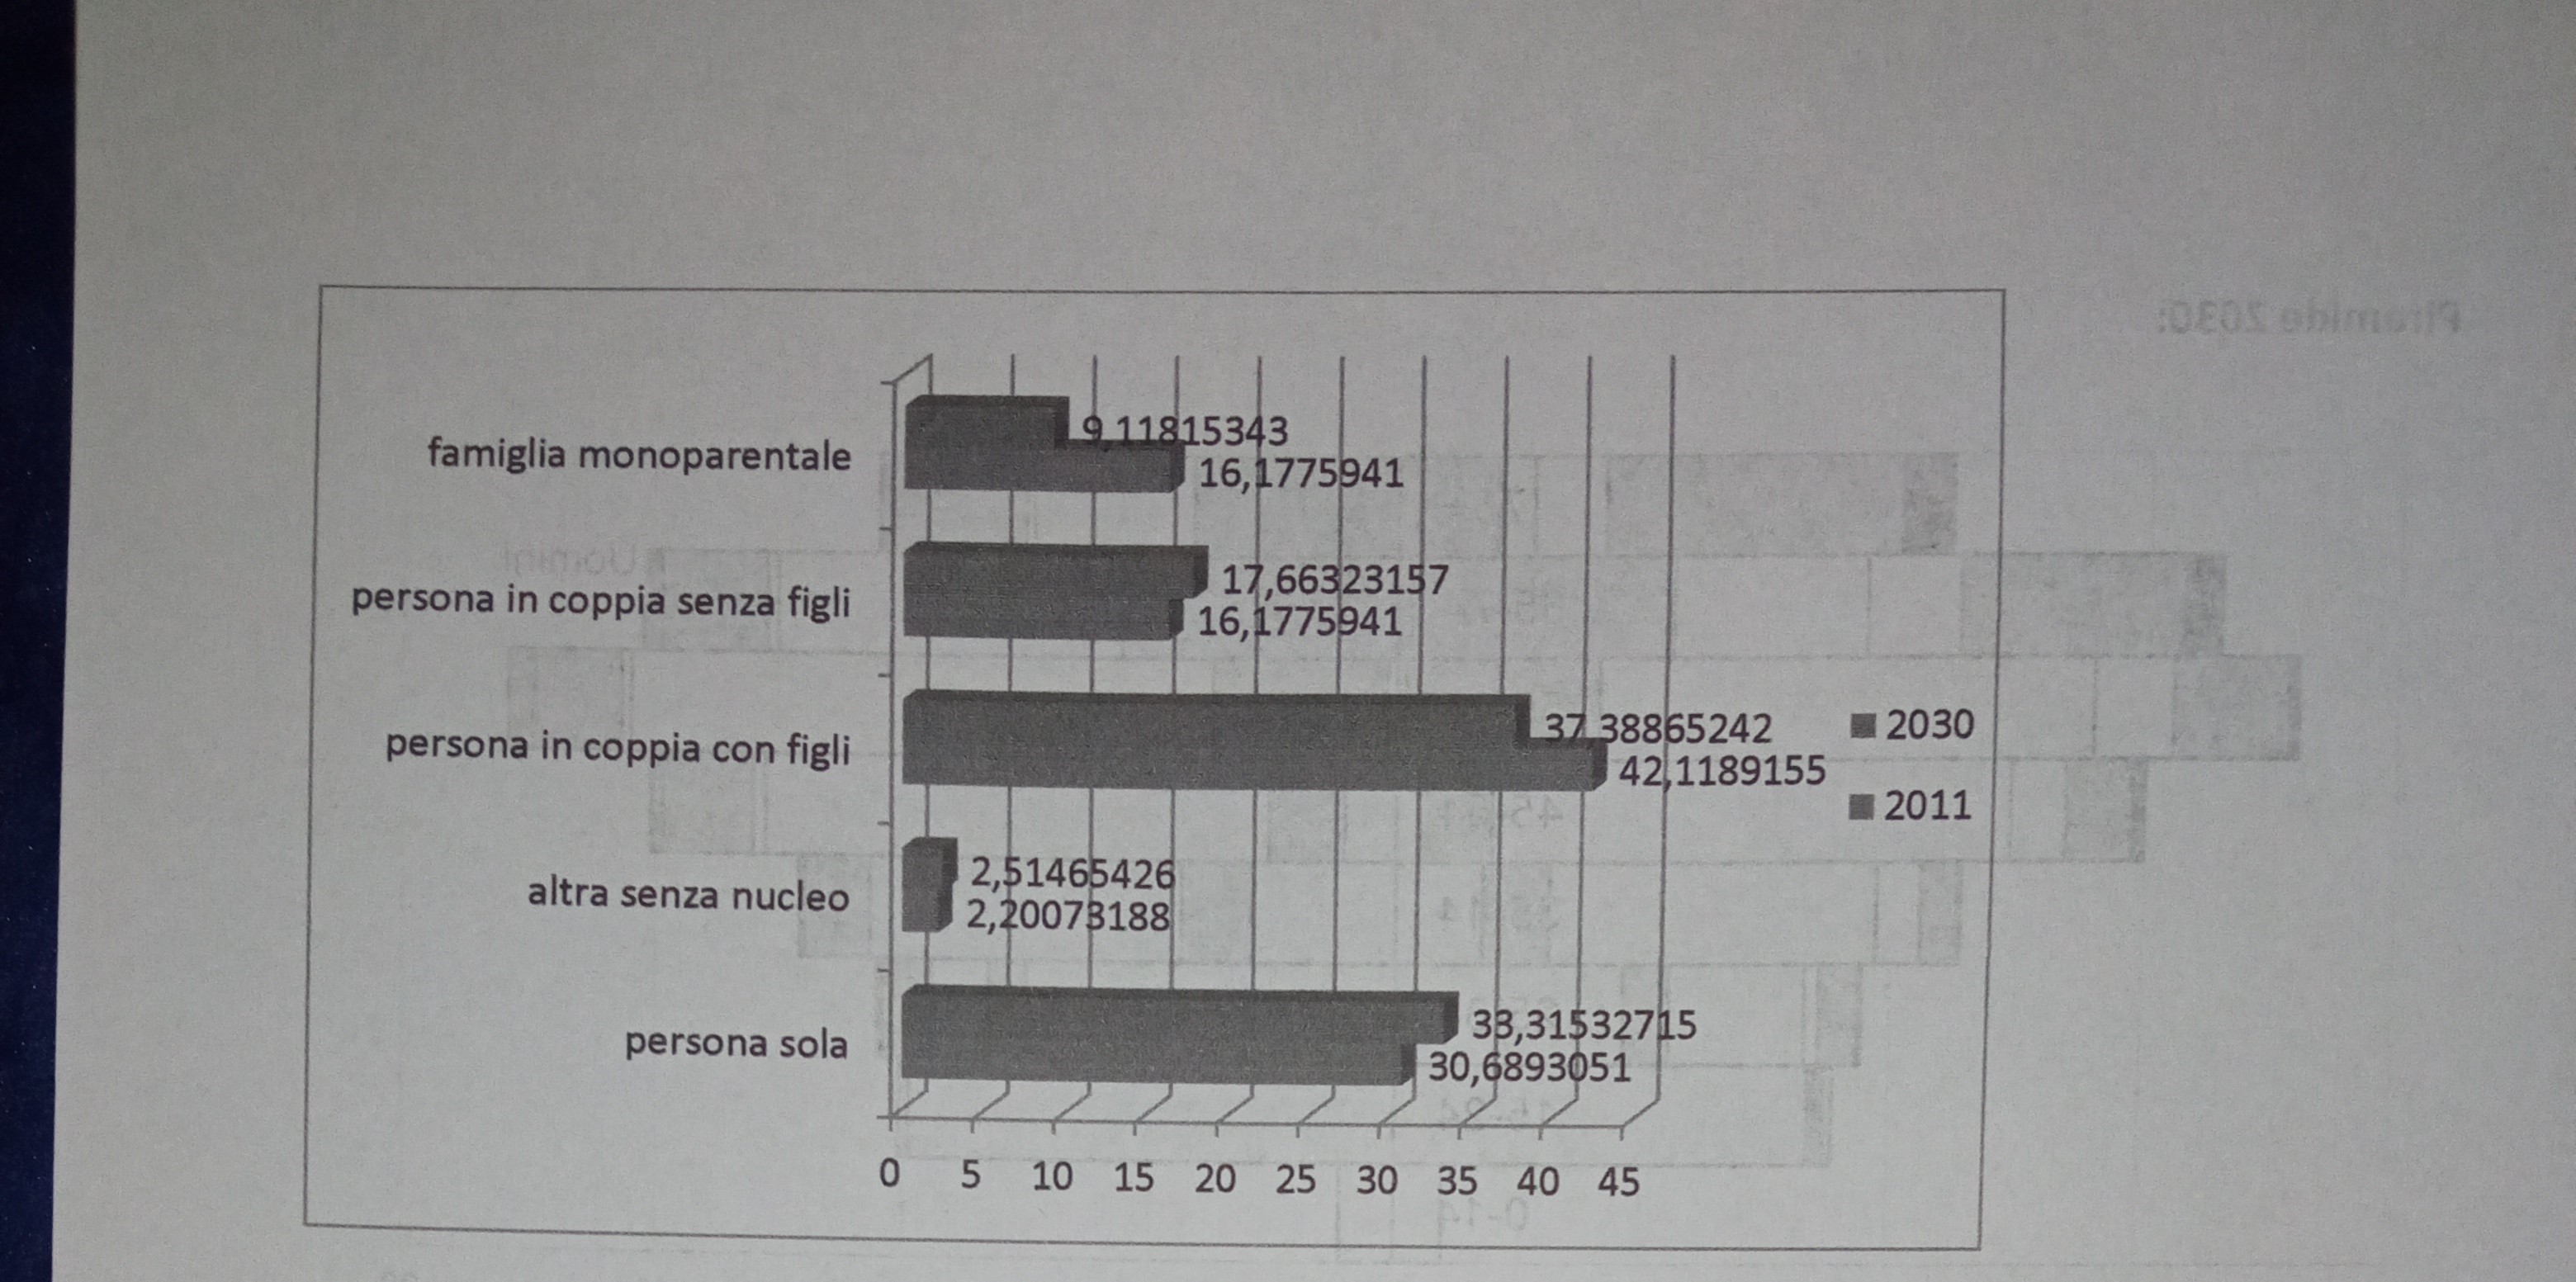
Line chart (percentages) – projection to 2030
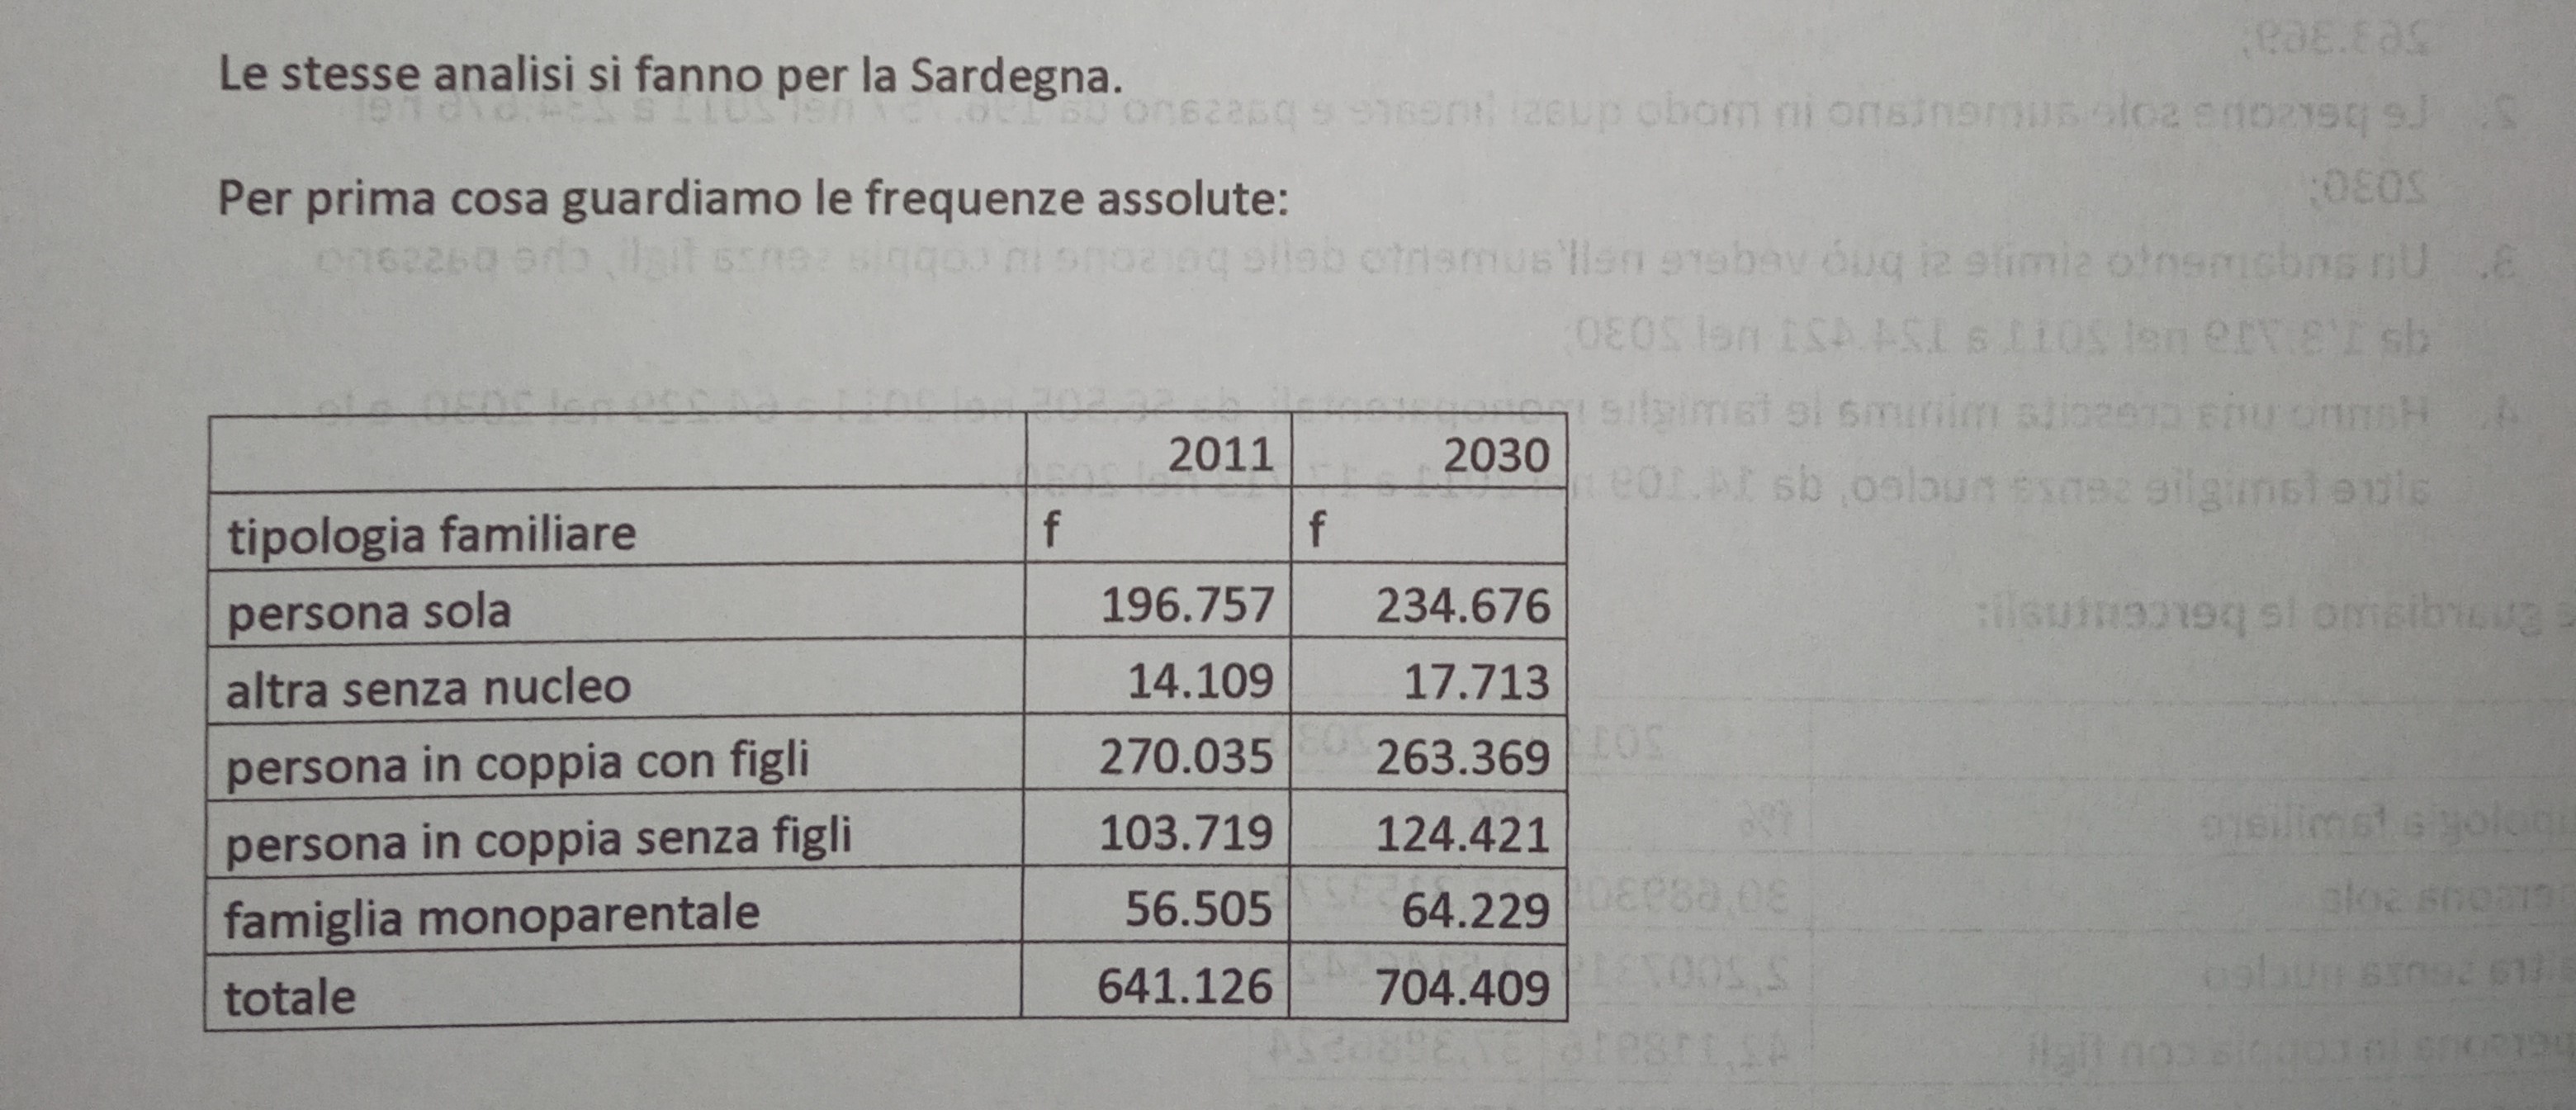
Projected distribution of main household typologies in Sardinia up to 2030 (table).
Projected distribution of main household typologies in Sardinia up to 2030 (chart).
Line chart (absolute values) – projection to 2030
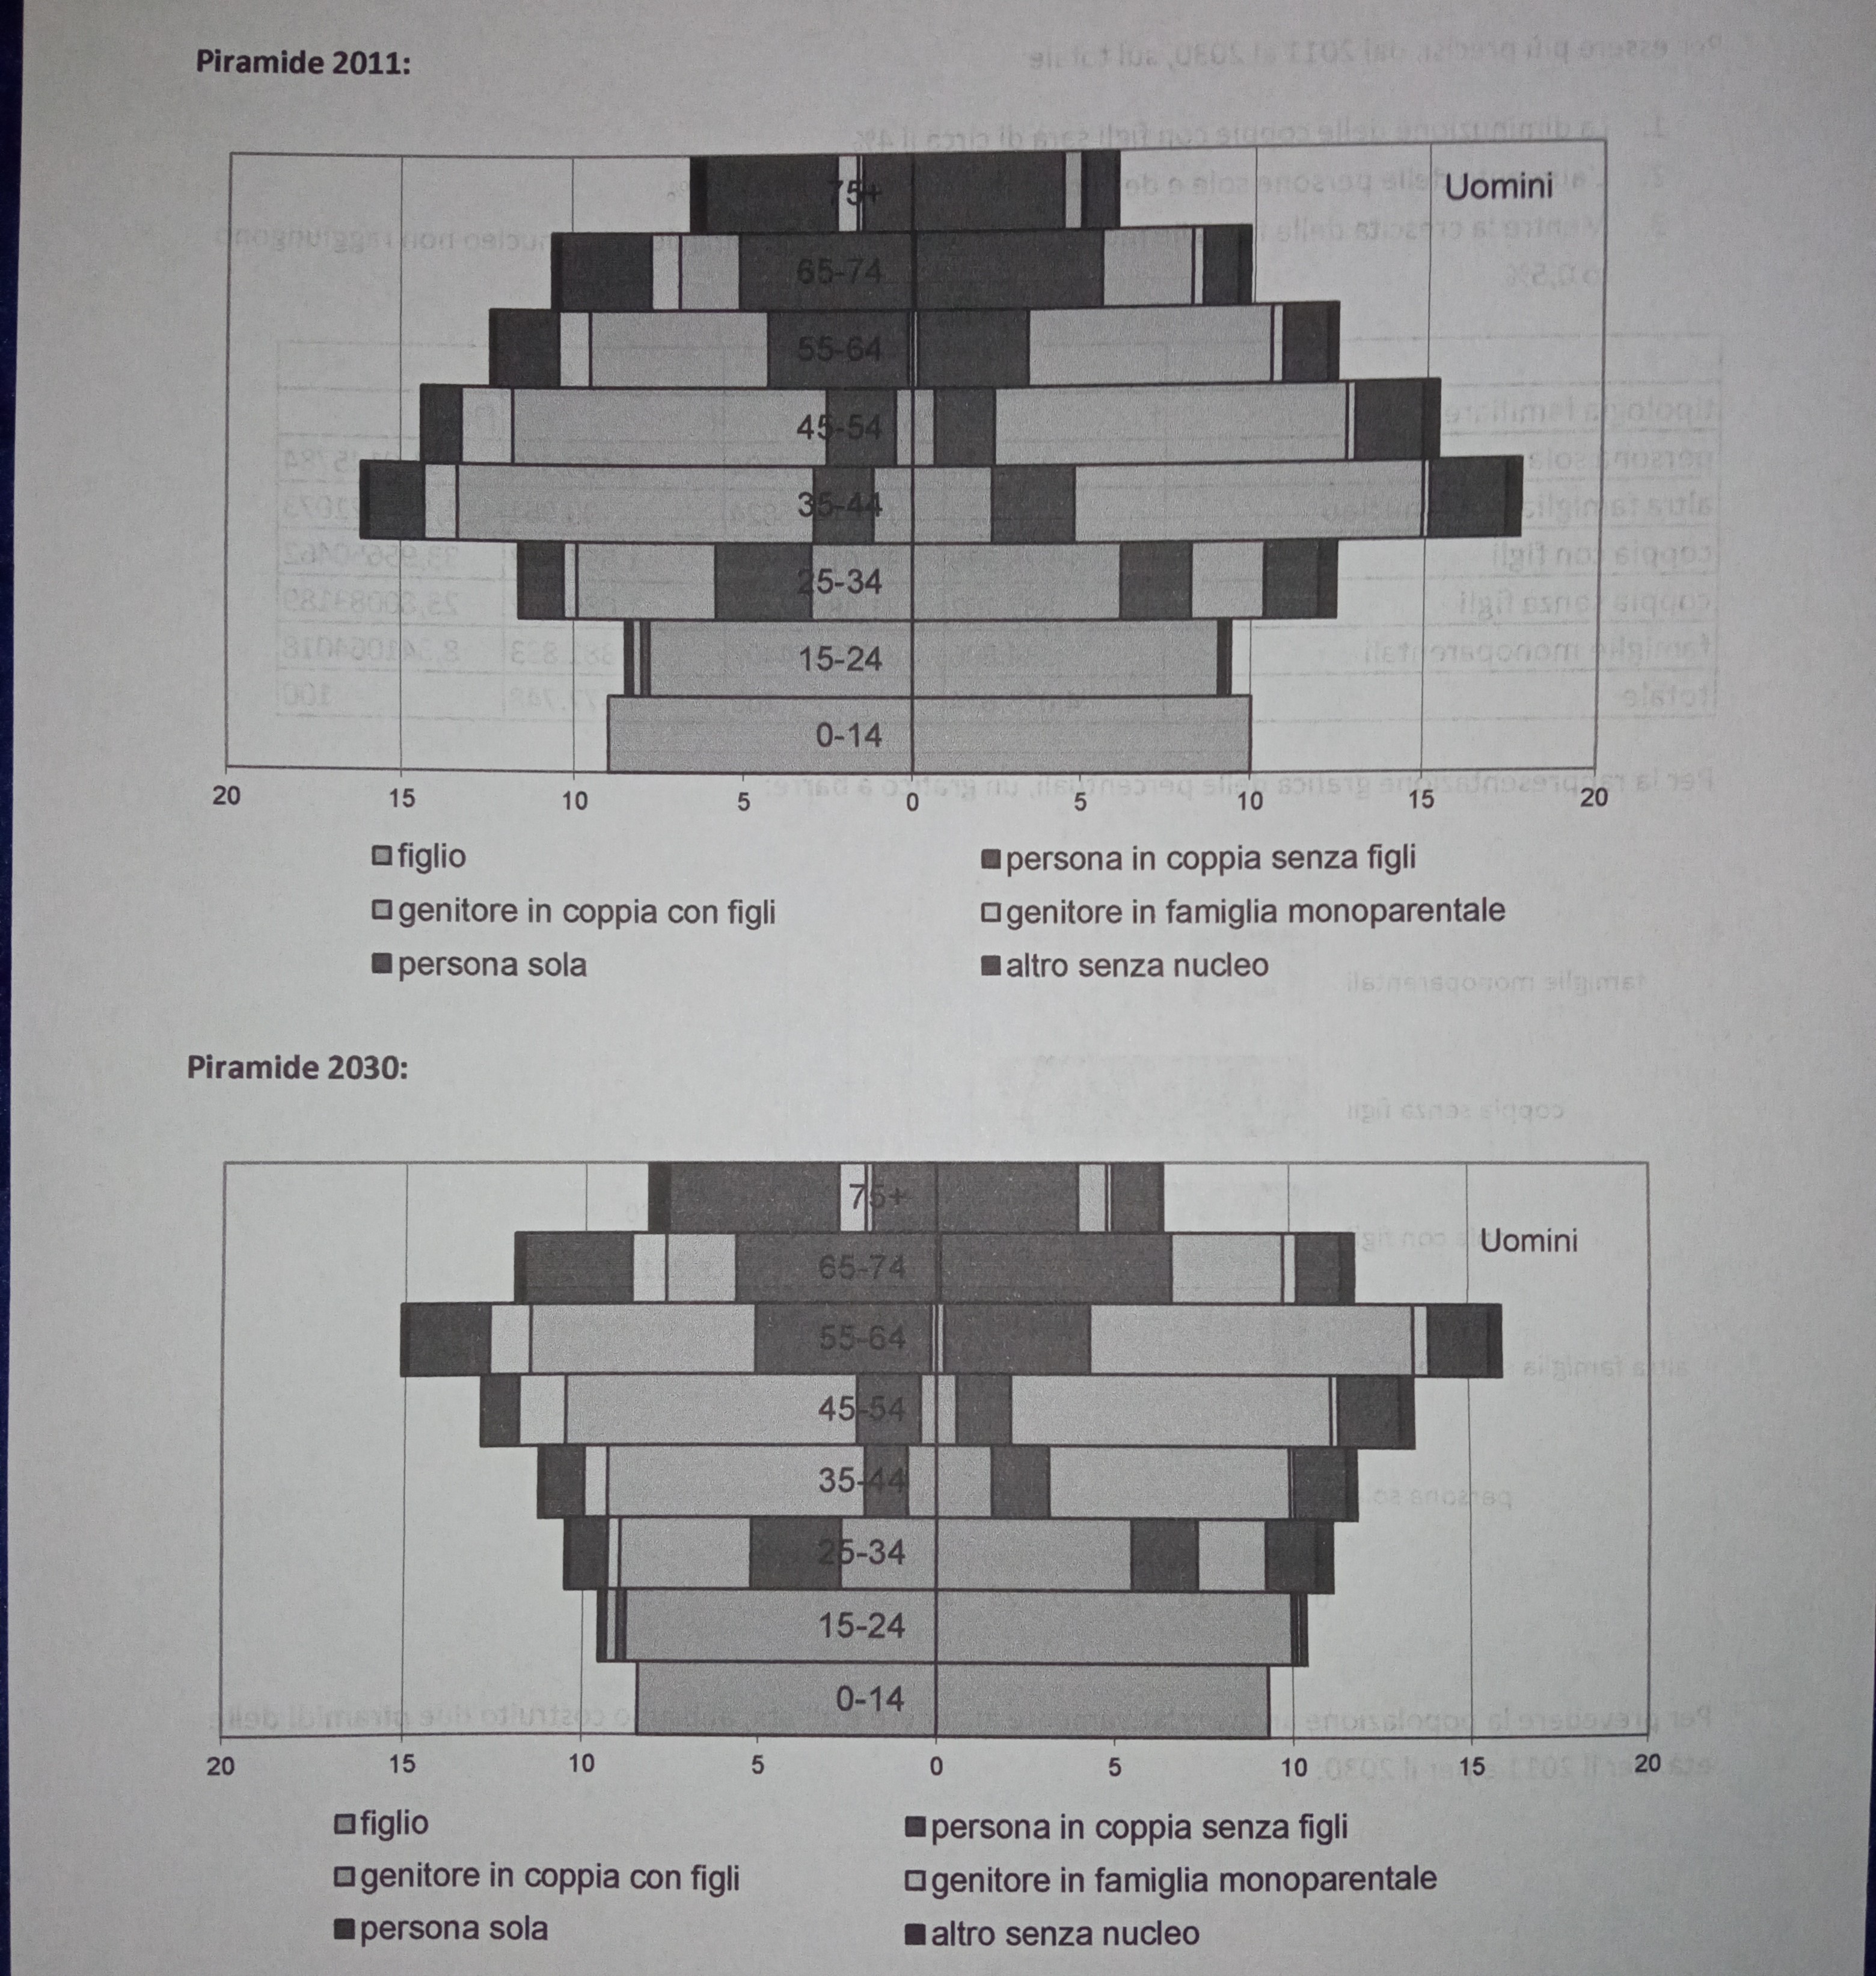
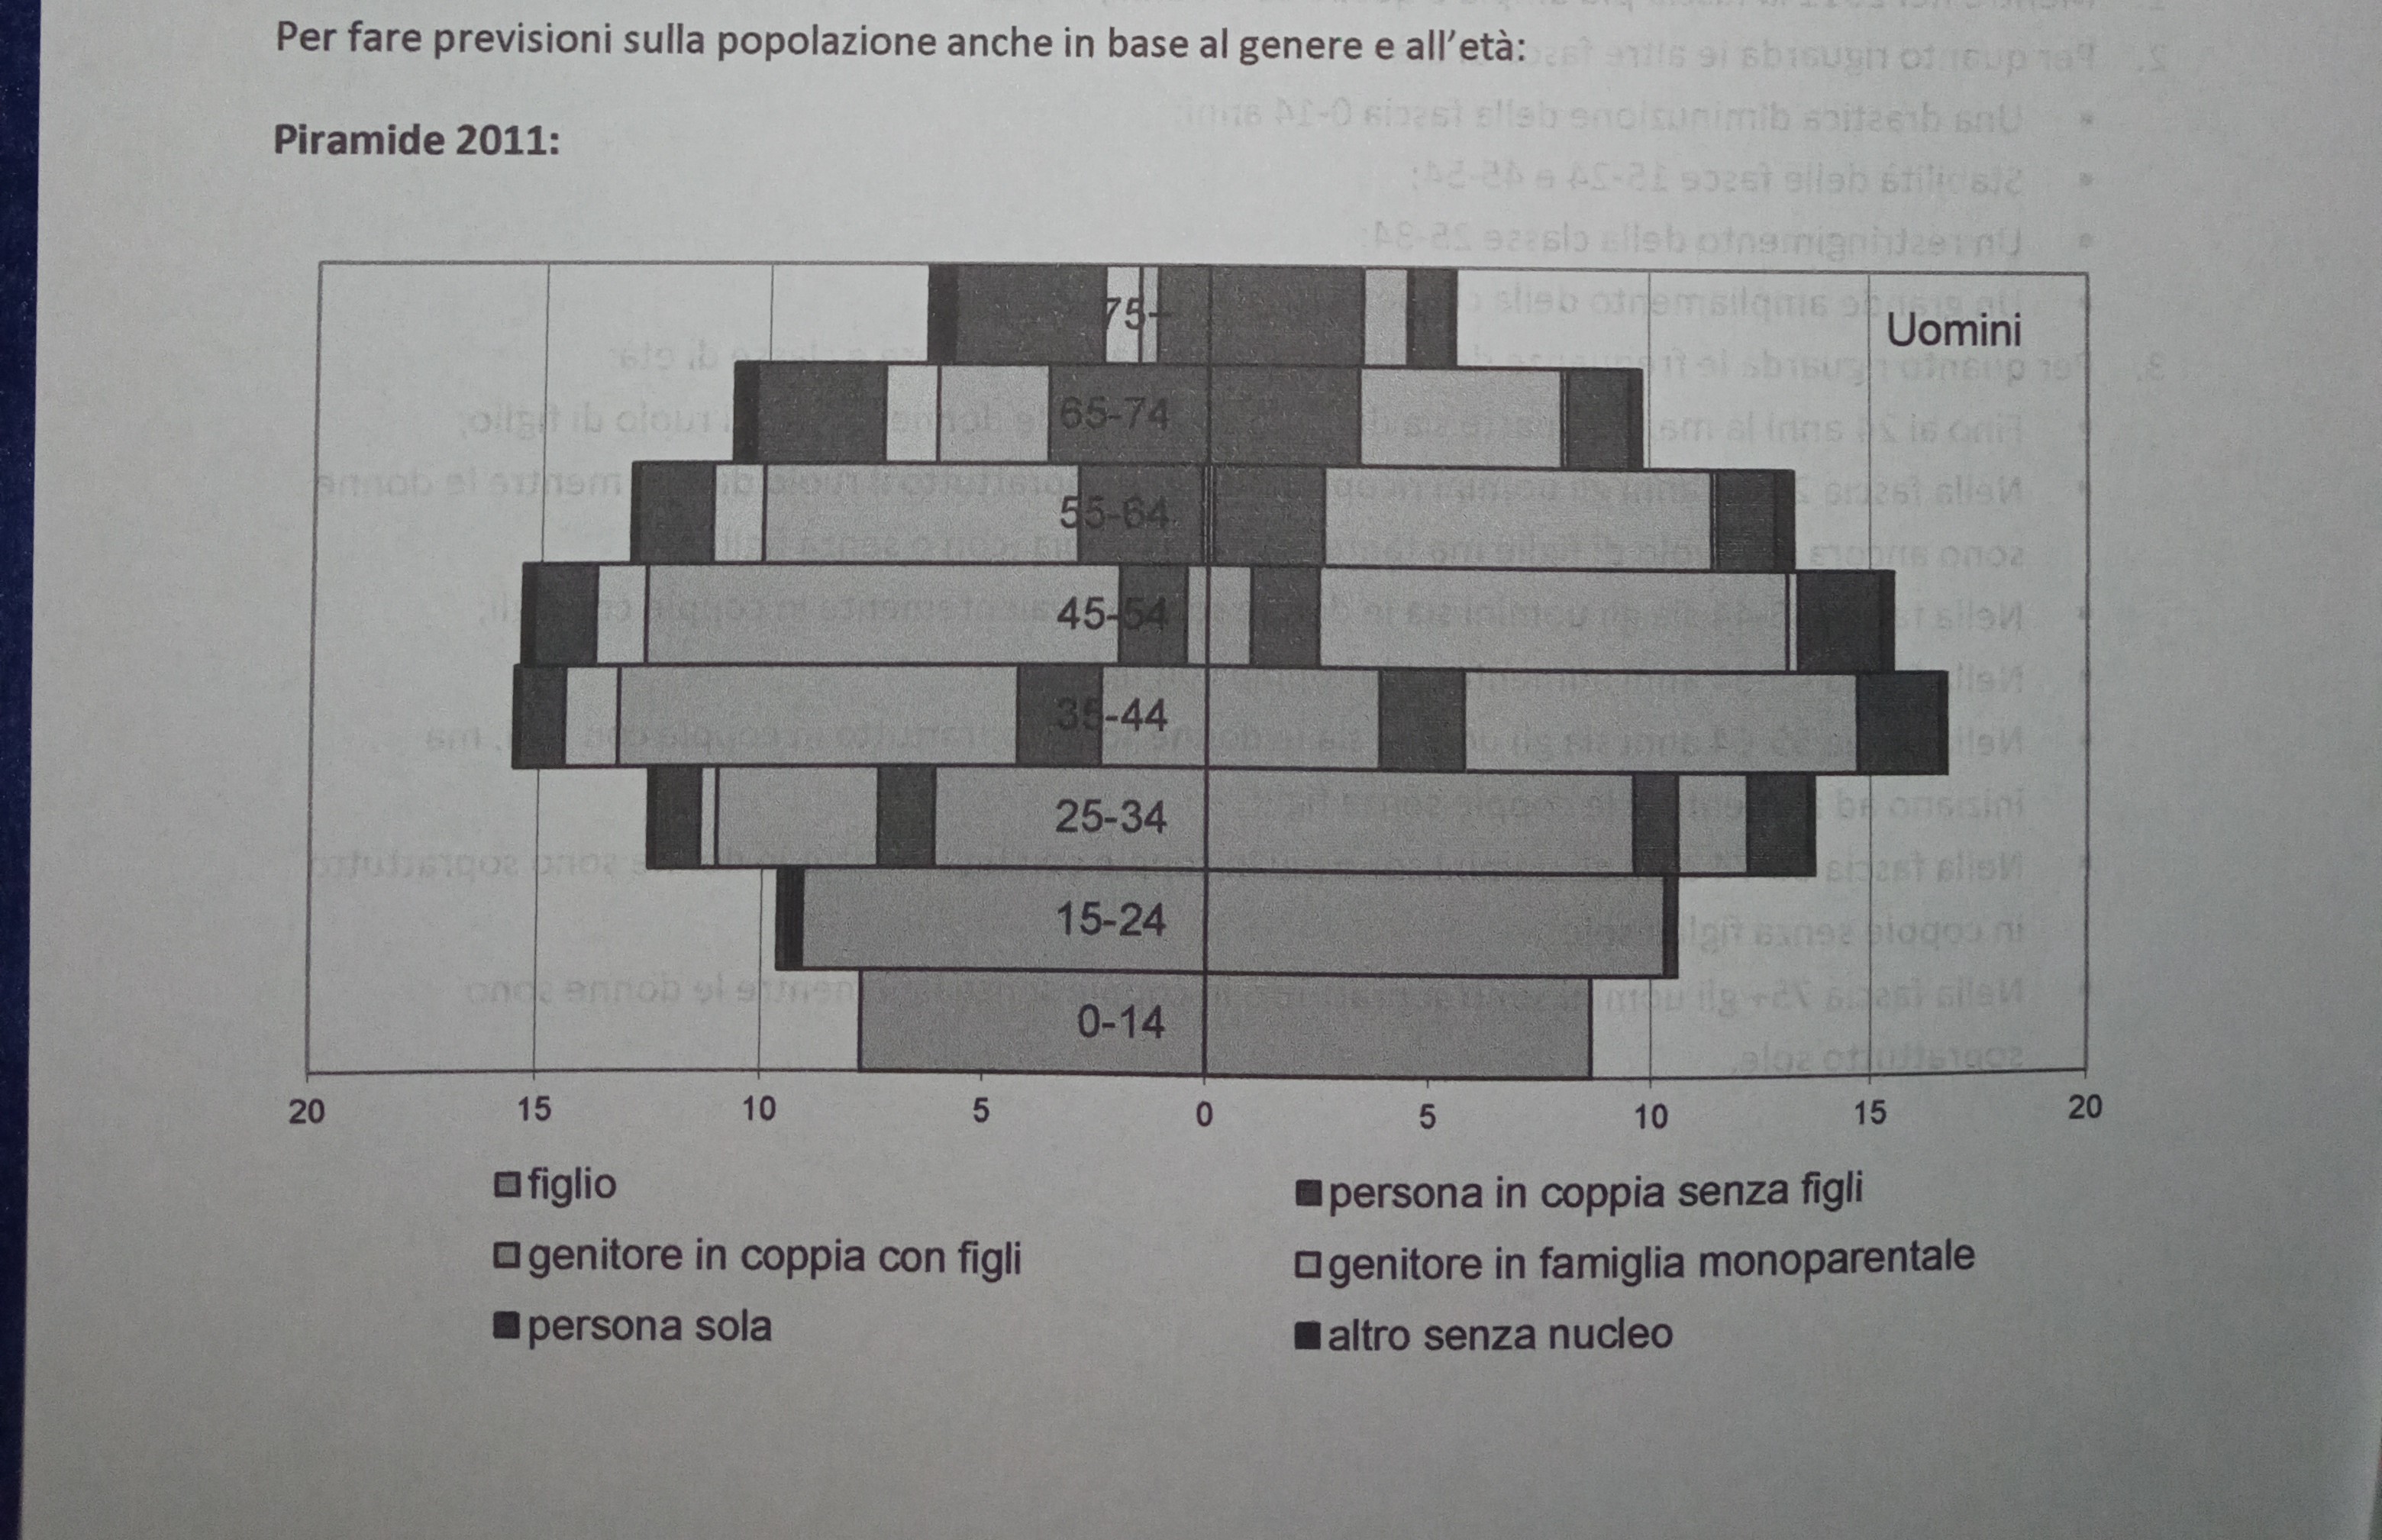
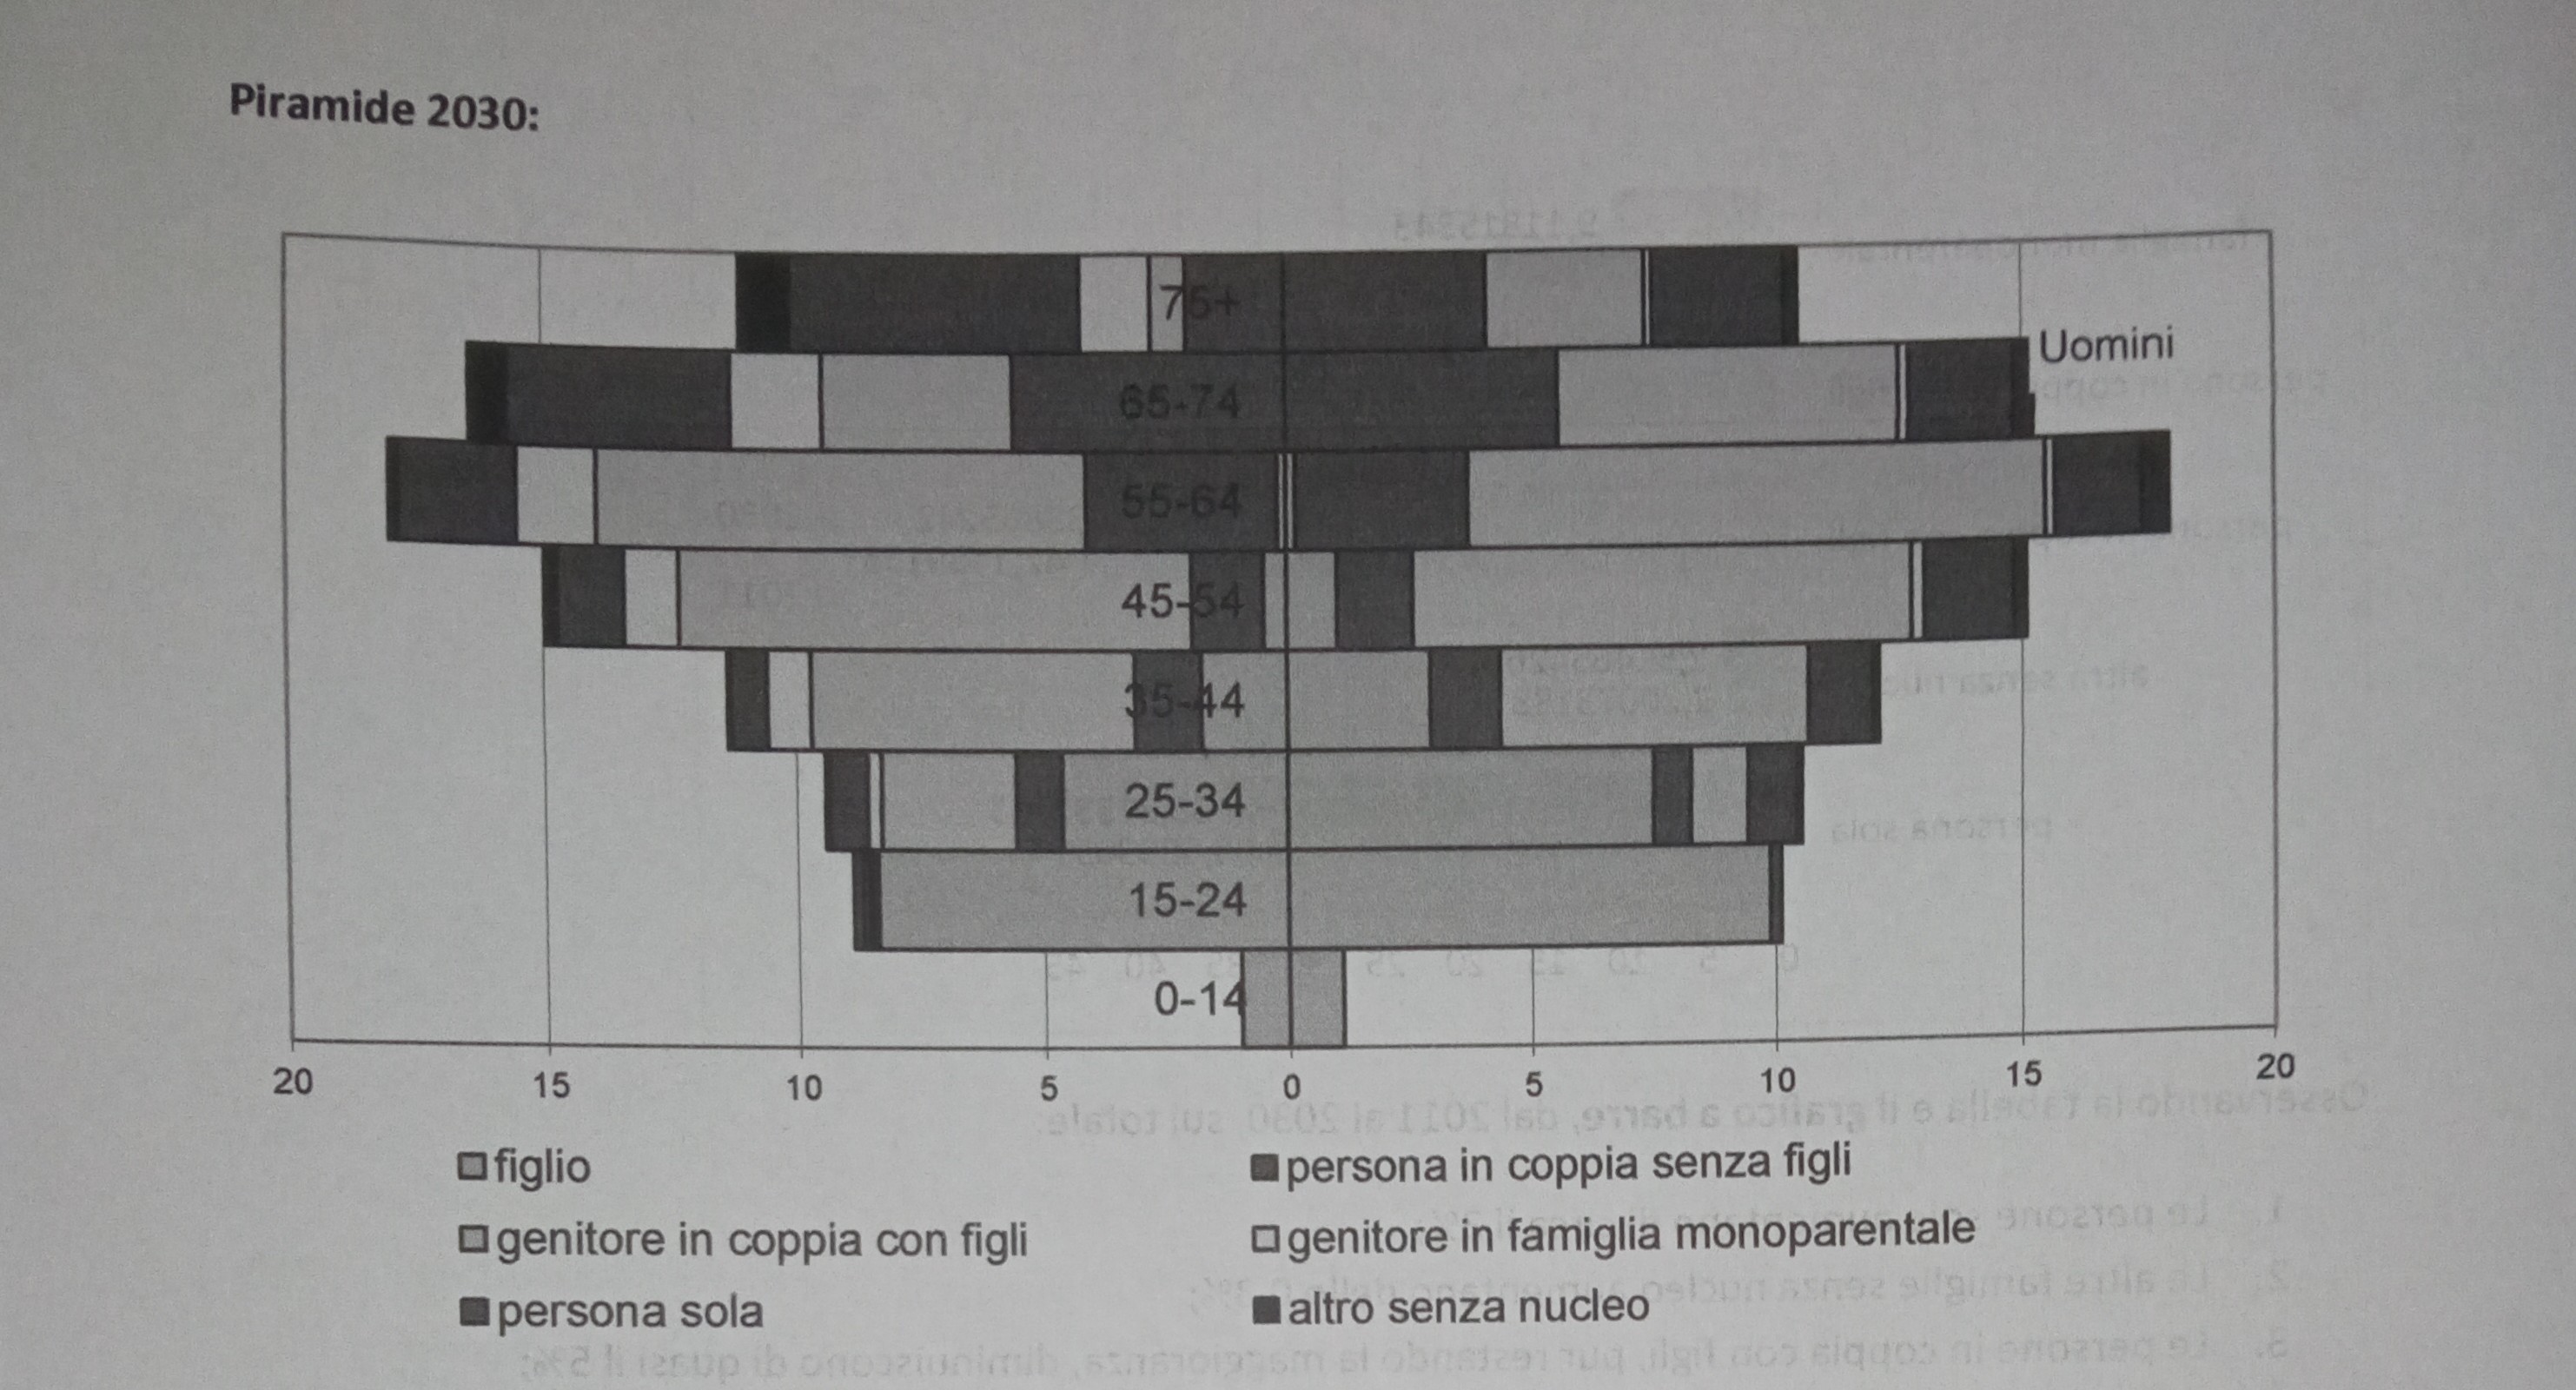
The age pyramid represents a key analytical dimension of the study, informing household formation dynamics and demographic structure evolution.
Projected population age structure by age and sex.
The age pyramid highlights structural demographic patterns relevant to the interpretation of household dynamics and ageing processes.